

Tables have long been a popular way of displaying related information that would be difficult to read if you provided the same information in paragraph form. Tables imply a structure to the data and thus are visual. Each row of the table represents an instance of whatever you are listing in the table while each column represents a common attribute for each of the rows. For example, a table might represent all of the TSRs in the district. Each row of the table represents one of the TSRs. The columns then represent attributes that describe more information about the TSR such as their name, school, employee ID, email address, and more.
That table structure makes it very visual and easy to interpret by non-disabled people. However, it also makes it hard for visually impaired people to understand the relationships in the data without the help of some accessibility features.
There are three main components to making a table accessible. I will not discuss here the mandatory requirement of color contrast which by now you should take as a given. Rather these three requirements are unique to tables no matter where you create them. Specifically, I will cover how to implement these components in Microsoft Word. Microsoft PowerPoint has similar features.
These three components are:
Maintain a Simple Table Structure
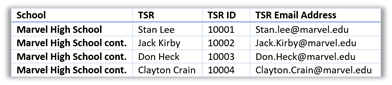
Maintaining a simple table structure means that you should not use split or merged cells. Screen readers read from left to right, top to bottom. Merged or split cells could be confusing when read by a screen reader as it either jumps over a cell or reads only the cell contents midway across a row without including the context of where it is in the table. Merged and split cells are typically the result of merging or splitting cells vertically. (There are times when you need to split or merge cells horizontally too.) Fixing vertically merged cells may be as simple as not merging the cells in the first place and placing the same text in each of the additional rows of that column with text that adds the word: Cont. to the end of the text. In the following figure, there is a school with four TSR’s. Rather than merging the common cells, you might do something like the following since all of the column data is unique except for the school name.
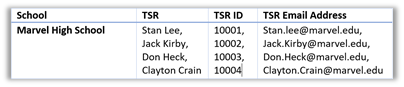
Another way to handle merged/split cells occurs when there are only one or two merged cells in the entire row of data. Then a better choice is the select the cells that were split, like the TSR’s names, and merge the cells vertically and then adding either a comma between each name or entering a line break between the values by placing your cursor between the names and pressing ENTER (In Excel to get a line break, you need to press: ALT-ENTER). Note, this is not the same as splitting a cell because it does not create additional cells. Also, depending on the number of items combined, this could make it harder to understand the associations between the column data making the first method referable.
In a similar manner, you should avoid blank rows or blank columns at all costs. If there is no information for that cell in the table, enter: NA so that it does not look like you skipped over a cell or forgot to enter a value when you really did not have a value for that cell.
Do not nest tables. This can be confusing when read by a screen reader in several ways. First, the nested table may have its own set of headers, title and alt-text. Second, the screen reader will not know when it has left the nested table and was back reading cells in the original table. Depending on the complexity of the nested table, this may not be easy to fix.
Screen Readers use the text in the heading row to remind the user in what column the text currently being read is located. Without a heading row, the user may not know where in the table they are. Heading text should be relatively short and the header row should appear at the top of the table page when the table spans multiple pages.
To define a heading row, select the row and then select the Table Tools Design tab. In this ribbon, make sure the Header Rows check box is selected. By default, it usually is, even if the text in the first row is not really heading text. How would it know? Many pre-defined styles use this information to format the header row different from the rest of the table. You can also access this property by:
- first selecting the first row of the table
- then right clicking anywhere within the selected cells
- then selecting Table Properties from the context menu
- then opening the Row tab in the Table Properties dialog
- finally selecting: Repeat as header row at the top of each page
How do you repeat the heading row without manually adding the row in the middle of table? First, adding the header row manually at the top of each new page would not be a good choice because changes in the formatting of the page could cause the table to split at unexpected points in the table. The preferred method is the select the heading row, then in the Table Tools Layout tab, select: Repeat Header Rows in the Data group. This will ensure that no matter where the table splits between pages, the top row on each page will be a repeat of the header row. Note, you should always do this even if you think your table is short. Also, while it is possible to have multiple rows serve as the header, just do not do it.
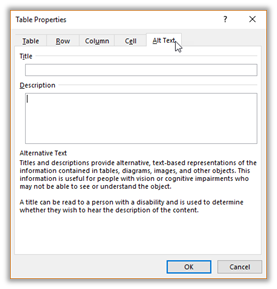
You probably remember from our discussion on images how important having alt-text is. However, did you know that tables also have alt-text? To add alt-text to a table, right click in any cell in the table and select Table Properties from the dropdown menu. Then in the Table Properties dialog, click the Alt-Text tab. As you can see in the dialog image below, the purpose of the Title field here is to give the vision impaired person a short description of the table before reading the table so they can skip over it. This is stored as the table’s title. The Description text should be a more detailed description of what is in the table including a listing of the fields (columns) that appear in the table. This data appears with the Summary attribute within the HTML of the table.
So, that leaves the Table Caption. Notice that in Word, as you move your mouse anywhere over the table, a small box with a ‘+’ within it appears in the upper left corner of the table.
Click on that box to open the Table’s context menu and select Insert Caption that appears close to the bottom of the menu.
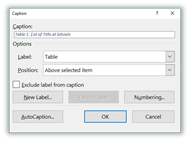
Enter an appropriate Table Caption after the text ‘Table 1:’ and click OK. Is a table caption necessary? I have seen mixed reports. However, in a large document with multiple tables, have table captions makes it easy to refer to different tables at different points within the document and will make it easier even for the visually impaired person to follow along.
Well, that is how to make tables accessible. You probably are performing most of these steps now. If you create the Word document as an Adobe PDF file, these accessibility features will be included in the PDF. When published to the web, these features will help visually impaired readers clearly understand what your table.
Next time, I will examine Accessibility checkers available to you from your desktop including one found directly within Microsoft Word.