

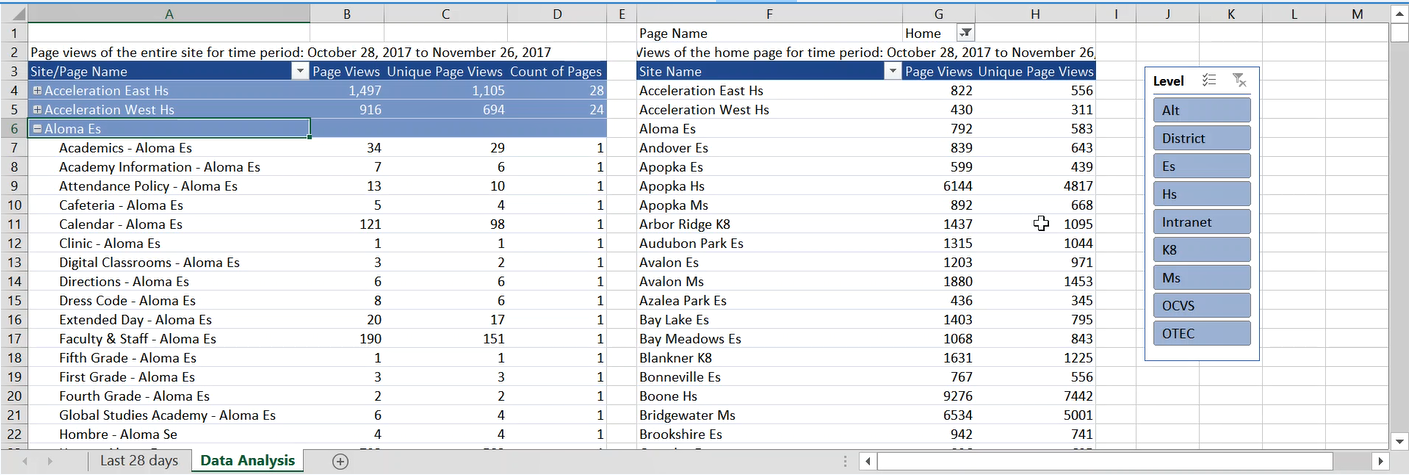
 I’ve been looking at a way to take information from Google Analytics and make it available to everyone, not just those who have access to Google Analytics. I’ve downloaded a sample data set for October 28, 2017 through November 26, 2017. I then loaded the data into an Excel spreadsheet and use pivot tables to analyze the data. Since it is an Excel spreadsheet, all employees should be able to open it.
I also created a short video to discuss how to use this Excel report. You can access this video at the link:
 https://web.microsoftstream.com/video/b00222ee-9954-4290-9731-6ab982388871
You can download and explore the beta version of the page view report from the link:
